Recovered source transcript
1The Marketing Intelligence Equation
2===================================
3
4SOURCE: Marketing intelligence equation infographic.png
5SOURCE ID: libsrc-26575879a0aa
6ORIGINAL SHA256: 759bb625344bb1359b65ef76d4ab6889c013949f7e64eb822cc208c251e3f2a1
7REVIEW: 2026-10-17. The original PNG is authoritative. This reading copy separates manually inspected mathematical transcriptions from raw OCR. It is not a verbatim embedded-text extraction.
8
9VISUAL REVIEW NOTES
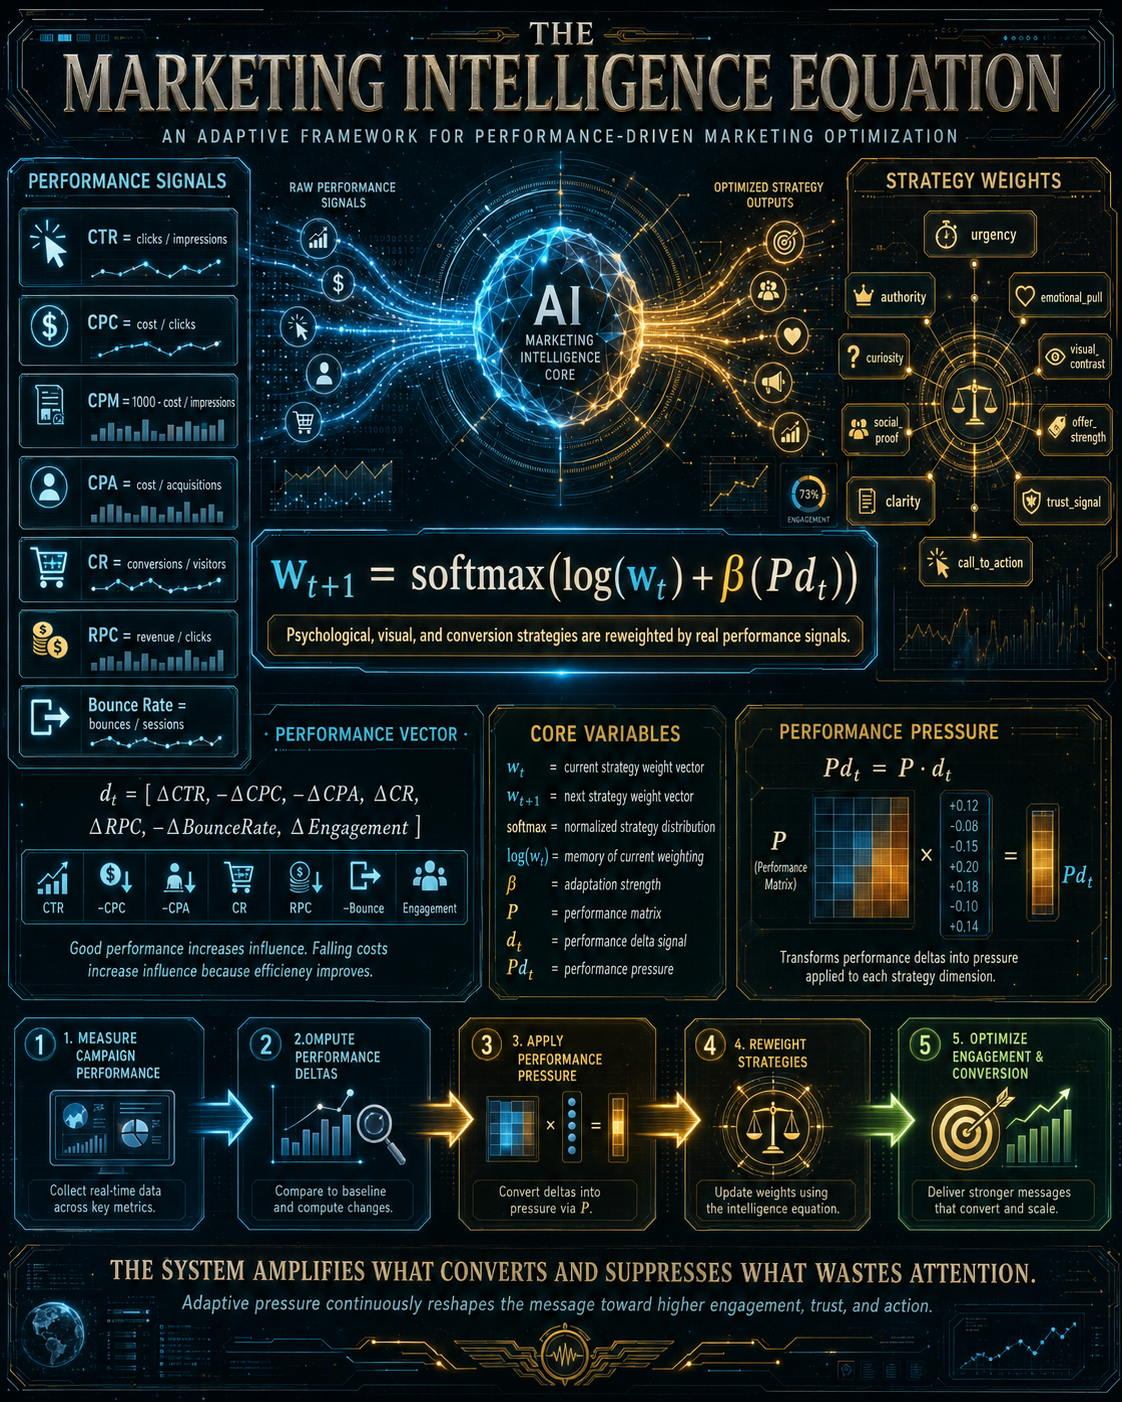
10- Strategy labels shown around the weights diagram are urgency, authority, emotional_pull, curiosity, visual_contrast, social_proof, offer_strength, clarity, trust_signal, and call_to_action.
11- The five-step workflow restates measure, compute deltas, apply matrix pressure, reweight, and optimize; it adds no further numeric equation.
12- This poster is conceptual evidence for the proposed update, not a verification of improved engagement or conversion.
13
14MANUALLY INSPECTED FORMULAS
15
16Adaptive strategy-weight update
17Image region: Central highlighted equation
18W_{t+1} = softmax(log(w_t) + β(Pd_t))
19Legibility: Legible
20Editorial mathematical explanation: Updates the strategy distribution by applying softmax to log current weights plus scaled performance pressure.
21Editorial note: The title equation visually uses W on the left while the variable legend labels w_{t+1}; retain that capitalization inconsistency.
22Editorial note: The poster provides no numeric performance matrix, initial strategy weights, adaptation strength, measurement interval, or execution evidence.
23Editorial note: The displayed log requires positive weights for a finite real-valued calculation.
24
25Performance-delta vector
26Image region: Lower-left PERFORMANCE VECTOR panel
27d_t = [ ΔCTR, −ΔCPC, −ΔCPA, ΔCR, ΔRPC, −ΔBounceRate, ΔEngagement ]
28Legibility: Legible
29Editorial mathematical explanation: Positive engagement, click-through, conversion and revenue changes increase the input, while cost and bounce changes have negative signs.
30Editorial note: CPM is listed as a measured performance signal but is absent from this displayed seven-component delta vector.
31
32Performance pressure
33Image region: Lower-right PERFORMANCE PRESSURE panel
34Pd_t = P · d_t
35Legibility: Legible
36Editorial mathematical explanation: Maps the delta vector through a performance matrix to produce pressure for each strategy dimension.
37
38Illustrative pressure-input vector
39Image region: Column vector in PERFORMANCE PRESSURE diagram
40[ +0.12, −0.08, −0.15, +0.20, +0.18, −0.10, +0.14 ]ᵀ
41Legibility: Legible
42Editorial mathematical explanation: Shows seven example signed input values entering the depicted matrix product.
43Editorial note: These are illustrative values shown in the poster. No sample, campaign dataset, units, or provenance for these numbers is supplied.
44
45Click-through rate
46Image region: Left PERFORMANCE SIGNALS column
47CTR = clicks / impressions
48Legibility: Legible
49Editorial mathematical explanation: Defines the named performance ratio used or referenced in the framework.
50Editorial note: Denominator-zero handling and time windows are not specified.
51
52Cost per click
53Image region: Left PERFORMANCE SIGNALS column
54CPC = cost / clicks
55Legibility: Legible
56Editorial mathematical explanation: Defines the named performance ratio used or referenced in the framework.
57Editorial note: Denominator-zero handling and time windows are not specified.
58
59Cost per thousand impressions
60Image region: Left PERFORMANCE SIGNALS column
61CPM = 1000 · cost / impressions
62Legibility: Legible
63Editorial mathematical explanation: Defines the named performance ratio used or referenced in the framework.
64Editorial note: Denominator-zero handling and time windows are not specified.
65
66Cost per acquisition
67Image region: Left PERFORMANCE SIGNALS column
68CPA = cost / acquisitions
69Legibility: Legible
70Editorial mathematical explanation: Defines the named performance ratio used or referenced in the framework.
71Editorial note: Denominator-zero handling and time windows are not specified.
72
73Conversion rate
74Image region: Left PERFORMANCE SIGNALS column
75CR = conversions / visitors
76Legibility: Legible
77Editorial mathematical explanation: Defines the named performance ratio used or referenced in the framework.
78Editorial note: Denominator-zero handling and time windows are not specified.
79
80Revenue per click
81Image region: Left PERFORMANCE SIGNALS column
82RPC = revenue / clicks
83Legibility: Legible
84Editorial mathematical explanation: Defines the named performance ratio used or referenced in the framework.
85Editorial note: Denominator-zero handling and time windows are not specified.
86
87Bounce rate
88Image region: Left PERFORMANCE SIGNALS column
89Bounce Rate = bounces / sessions
90Legibility: Legible
91Editorial mathematical explanation: Defines the named performance ratio used or referenced in the framework.
92Editorial note: Denominator-zero handling and time windows are not specified.
93
94SOURCE-LOCAL SYMBOL DEFINITIONS
95w_t = Current strategy weight vector.
96w_{t+1} = Next strategy weight vector; the large equation uses a capital-shaped W on its left side.
97softmax = Normalized strategy distribution.
98log(w_t) = Memory of current weighting.
99β = Adaptation strength.
100P = Performance matrix.
101d_t = Performance delta signal.
102Pd_t = Performance pressure.
103CTR = Clicks / impressions.
104CPC = Cost / clicks.
105CPM = 1000 · cost / impressions.
106CPA = Cost / acquisitions.
107CR = Conversions / visitors.
108RPC = Revenue / clicks.
109BounceRate = Bounces / sessions.
110
111RAW OCR READING AID — NOT A VERIFIED EQUATION TRANSCRIPT
112The following preserves the complete Tesseract output, including recognition errors, decorative glyphs and layout artifacts. Use the manually inspected records above and the original PNG for mathematical notation.
113
114a ey
115
116—
117
118es
119
120=
121
122—=- THE =—
123
124¢
125
126"MARKETING INTELLIGENCE EQUATION
127
128Y
129
130AN ADAPTIVE FRAMEWORK FOR PERFORMANCE-DRIVEN MARKETING OPTIMIZATION
131
132PERFORMANCE SIGNALS
133
134RAW acoawance
135
136OPTIMIZED STRATEGY
137
138_ STRATEGY WEIGHTS
139
140Aly
141
142CTR
143
144clicks / impressions
145
146x
147
148lox
149
150yg
151
1524,
153
154authority
155
156emotional pul
157
158—
159
160CPC
161
162cost / clicks
163
164Al
165
166v\
167
168_ MARKETING
169
170==
171
172K!
173
174INTELLIGENCE
175
176Ty
177
178A
179
180© iis
181
182CPM =1000- cost / impressions
183
184CORE Zh
185
186Wy
187
188allt!
189
190nl
191
192a
193
194offer
195
196Eee
197
198sted
199
200ave © pee
201
202CPA = cost / acquisitions
203
204BLL PeLLeLeL eo
205
206@ trust signal
207
208e200
209
210CR = conversions / visitors
211
212)
213
214aN
215
216* call_to. meh
217
218Wrat = softmax(log(w;) + B(Pd,))
219
220A
221
222So RPC = revenue / clicks
223
224f Psychological, visual, and conversion strategies are reweighted by real performance signals. |
225
226U
227
228=
229
230ae
231
232Bounce Rate =
233
234—
235
236—
237
238=r
239
240\)
241
242>
243
244bounces / sessions
245
246PERFORMANCE VECTOR
247
248CORE VARIABLES
249
250(rr PERFORMANCE PRESSURE
251
252y
253
254We
255
256= current strategy weight vector |
257
258Pd, = P-d,
259
260d, = [ ACTR, -ACPC, -ACPA, ACR
261
262Wear = next strategy weight vector
263
2647
265
266i
267
26840.12 |)
269
270ARPC, -ABounceRate, A Engagement |
271
272softmax = normalized strategy distribution
273
2740.08
275
276LI
277
2780.15
279
280log(w,) = memory of current weighting
281
282(Performance
283
284+020
285
286i;
287
288al
289
290i
291
292on Fab
293
294B
295
296= adaptation strength
297
298Matrix)
299
300iM _:
301
30240.18
303
304cTR
305
306=cPC
307
308CPA
309
310cR
311
312RPC
313
314Bounce Engagement
315
316P
317
318= performance matrix
319
320!
321
3220.10
323
324i.
325
326|
327
32840.14
329
330Good performance increases influence. Falling costs
331
3324,
333
334= performance delta signal
335
336increase influence because efficieney improves.
337
338Pd, = performance pressure
339
340Transforms performance deltas into pressure
341
342=
343
3442
345
346—
347
348ape tech stag denn
349
3501. MEASURE
351
352CAMPAIGN
353
3542.0MPUTE
355
3563. APPLY
357
3584, REWEIGHT
359
3605. OPTIMIZE
361
362ENGAGEMENT &
363
364PERFORMANCE
365
366DELTAS
367
368PERFORMANCE
369
370PERFORMANCE
371
372PRESSURE
373
374‘STRATEGIES
375
376CONVERSION
377
378|
379
380|
381
382==
383
384°
385
386all
387
388ul
389
390+
391
392PP)
393
394©
395
396Collect real-time data
397
398Compare to baseline
399
400Convert deltas into
401
402Update weights using
403
404Deliver stronger messages
405
406across key metrics.
407
408and compute changes.
409
410|
411
412pressure via P.
413
4144
415
416the intelligence a
417
418*s
419
420that convert and scale,
421
422=
423
424OF
425
426THE SYSTEM AMPLIFIES WHAT CONVERTS AND SUPPRESSES WHAT WASTES ATTENTION
427
428Adaptive pressure continuously reshapes the message toward higher engagement, trust, and action.
429
430JN
431
4322
433
434NA
435
436pe Md
437
438A
439
440—— & =
441
442NS
443
444r= A
445
446=—/
447
448